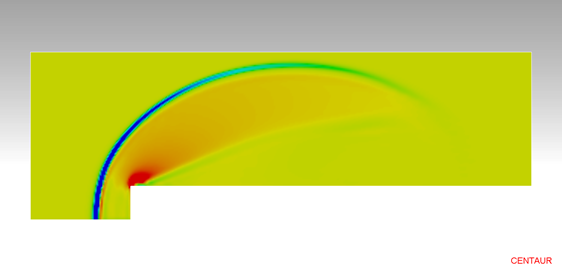
Flow Field Visualization
Both solution data and user-defined field variables (algebraic and derivative expressions) can be visualized. Particle paths are also calculated and visualized. Sample examples are shown below:

Surface Colored According to Pressure

Mixing Flow Colored by Temperature
Field of Velocity Divergence
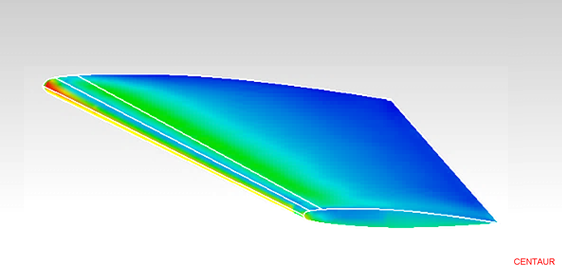
Wing Surface Colored by Wall Shear Stress
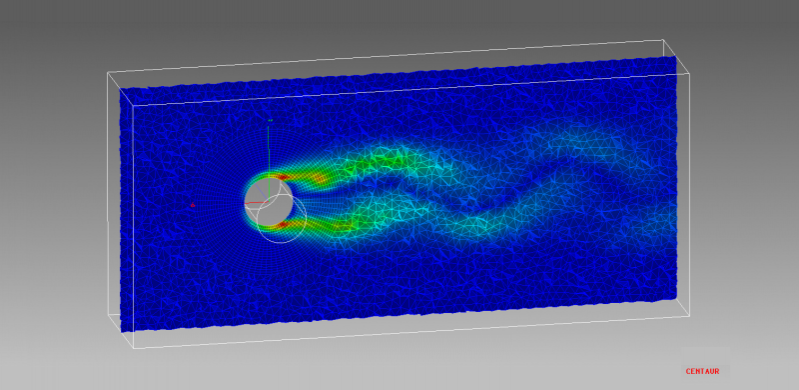
Mesh Cut Colored by Vorticity

Particle Paths

Pressure Field with Isolines

Streamwise Velocity Field with Isosurfaces